
Data-intensive science is concerned with collecting, archiving, and analyzing the vast amounts of data being produced and accumulated by modern science. Turning scientific raw data into knowledge will be the key for future scientific discoveries. A typical data-intensive science project has the following major steps:
The focus of Scolopax is on exploratory analysis. An essential aspect of exploratory analysis is the use of non-parametric (or semi-parametric) data mining techniques. These techniques enable scientists to train accurate prediction models of complex processes even in the absence of a complete understanding of these processes. Using such models for analysis is preferable compared to simply summarizing the raw data directly. A model with good generalization performance does not overfit to noise or a specific data sample and hence captures the natural process more accurately. Unfortunately, complex prediction models per se are not intelligible. They cannot be used directly for answering questions like 'Which environmental features have the strongest effect on bird abundance and how do they interact?'. To make data mining models 'digestible' and to provide end users with new hypotheses, we need to 'open up the blackbox', i.e., provide tools for determining important relationships that the model has learned. This can be done by summarizing a complex model with simpler patterns like partial dependence functions. The number of such model summaries is overwhelming: each 'slice' or 'dice' of a lower-dimensional subspace of the original data space could contain an interesting model summary.
Warning: Since Scolopax can rapidly explore a large search space, it is prone to discovering spurious patterns as well real ones. Good scientific practice requires all patterns discovered to be verified on newly collected data, i.e., based on a specially designed experiment where the pattern informs the hypothesis. At the very least, consult your friendly neighborhood domain expert before getting too excited about a surprising new pattern :)

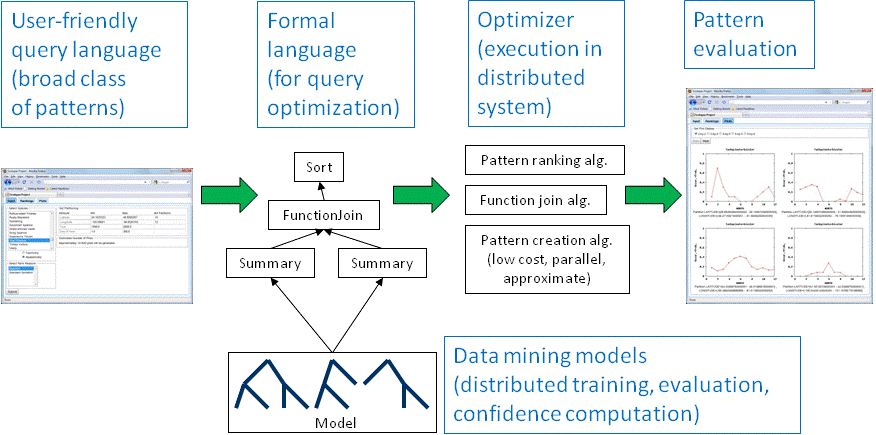
The Scolopax project addresses various data management challenges to enable exploratory analysis (see system overview above). Scientists will be able to express their exploration preferences in a user-friendly language. The preference specification will then be automatically transformed into a formal query, for which Scolopax finds an efficient execution plan for a multi-processor environment like a cluster or Cloud. Other Scolopax components are concerned with post-processing of the discovered patterns and efficient training of data mining models. Our approach is validated through our ongoing collaboration with the Cornell Lab of Ornithology, using citizen science data and other data resources organized by the ornithological community in the Avian Knowledge Network (AKN).
The Scolopax system is briefly described in a demonstration paper published at VLDB 2013. It currently consists of four different components: Summary Ranker, Cluster Ranker, Correlation Finder, and Performance Monitor. All four components work with summaries that are generated on-the-fly for a data mining model. This model was trained on a large high-dimensional data set containing crowd-sourced data about bird sightings reported by citizen scientists through the eBird project. Processing happens in parallel on a 44-core cluster running the Hadoop version of MapReduce. Results from previous analyzes are stored in an HBase database on the same cluster to speed up future queries.
Summary Ranker: version with frames or without frames. This component supports search for interesting model summaries. Each summary is a partial-dependence plot on some summary attribute, visualizing the effect of this attribute on the observation probability of some bird species by taking the average effect of all other attributes into account. For instance, a strong down-trend in the summary for YEAR suggests a decline of the species in the corresponding region. The user can select bird species, regions of interest, and a measure to rank the model summaries created for different attributes by their "interestingness". (Scolopax will generate and rank all one-dimensional summaries according to the specifications.) After the ranked list of results is presented, the user can post-process it by filtering out groups of summaries that are not of interest. The summary ranker uses HBase to store and manage query results. If a submitted query and ranking measure are found in the database, the old results are re-used, speeding up processing significantly. If the same query is used with a different ranking measure, some speedup is achieved since existing summaries are re-used, but have to be re-ranked on-the-fly. For new queries, all summaries are computed from scratch and ranked on-the-fly.
Cluster Ranker: version with frames or without frames. This component supports the discovery of spatio-temporal movements of bird species, in particular migration. It works with the same kind of model summaries as the Summary Ranker. Instead of ranking individual summaries, the Cluster Ranker first clusters summaries on temporal attributes by their similarity. Then the clusterings are ranked based on how different the cluster centers are from each other. (This indicates regionally different temporal trends.)
Correlation Finder: version with frames or without frames. This component supports discovery of correlations between model summaries. It can be used to find potential habitat competition between species (find two species that show complementary abundance trends in a certain region over the years) and diverse migration trends (find two species with different seasonal pattern of abundance). The correlation finder also works with large sets of model summaries. Users specify a join query through an intuitive interface. The join result is computed in parallel using our recently proposed techniques.
Performance Monitor: version with frames or without frames. This component visualizes the performance improvement resulting from our research compared to the previous state of the art. It executes the summary ranker and continuously reports the progress in terms of summaries computed.
[A. Okcan and M. Riedewald. Anti-Combining for MapReduce. In Proc. ACM
SIGMOD Int. Conf. on Managament of Data, 2014 ]
We propose the notion of anti-combining to reduce cost and hence optimize for
throughput in MapReduce systems. Anti-combining pushes functionality from
Mappers to Reducers in order to decrease network transfer and local disk I/O
cost. This is achieved through syntactic re-writing that can be applied
automatically to any given MapReduce program. The modified program then performs
fine-grained local optimizations at runtime in order to reduce the cost of the
data transfer between Mappers and Reducers.
[A. Okcan, M. Riedewald, B. Panda, and D. Fink.
Scolopax: Exploratory Analysis
of Scientific Data. In Proc. of the VLDB Endowment (PVLDB), 2013]
This paper provides an overview of the Scolopax system as of the end of summer,
2013.
[A. Okcan and M. Riedewald.
Processing Theta-Joins using MapReduce.
In
Proc. ACM SIGMOD Int. Conf. on Managament of Data,
pages 949-960, 2011]
To find related summaries, we need flexible join operators, not just standard
equi-joins. We developed novel techniques for efficiently computing arbitrary
theta-joins in parallel, with particular focus on MapReduce systems. Our most
general algorithm is randomized and provably achieves a near-optimal low latency. For popular join predicates, including equi-,
inequality-, and epsilon-join, we present specialized techniques that work well,
no matter how skewed the data distribution.
[B. Panda, M. Riedewald, and D. Fink.
The Model Summary Problem and a Solution for
Trees. In Proc. IEEE Int. Conf. on Data
Engineering (ICDE), pages 449-460, 2010]
Model summaries form the basis for exploratory analysis. For a typical analysis,
millions to billions of such summaries have to be created. We show how to
exploit workload properties to reduce computation time asymptotically, perform
fast batch computation, and effectively parallelize the workload in MapReduce.
[A. Lachmann
and M. Riedewald.
Finding Relevant Patterns in Bursty Sequences.
In Proc. of the VLDB Endowment (PVLDB), 1(1):78-89, 2008]
Finding relevant frequent patterns in bursty sequences is expensive and suffers
from a large number of un-interesting patterns with high support. We propose a
novel approach that addresses both problems and prove important properties
regarding preservation of interesting sequences.
[D. Sorokina,
R. Caruana, M. Riedewald, and D. Fink.
Detecting
Statistical Interactions with Additive Groves of Trees. In Proc.
International Conference on Machine Learning (ICML), pages 1000-1007, 2008]
[D. Sorokina
, R. Caruana, M. Riedewald, W. M. Hochachka, and S. Kelling.
Detecting and
Interpreting Variable Interactions in Observational Ornithology Data. In Proc. IEEE Int. Workshop on Domain Driven Data Mining (DDDM), 2009]
Model summaries inherently lose information compared to the full model. To
better understand when a summary might be hiding important information, we need
to understand which variables strongly interact. Our techniques identify such
variables using a mostly non-parametric approach.
[B. Panda, M.
Riedewald, J. Gehrke, and S. B. Pope:
High-Speed Function
Approximation. In Proc. IEEE Int. Conf. on Data Mining (ICDM),
pages 613-618, 2007]
While traditional data mining research usually focused on model accuracy and
training cost, exploratory analysis shifts the bottleneck to the prediction
phase, when the model is actually being used. We propose approximation techniques
that significantly speed up precition time, while
maintaining high prediction accuracy.
In addition to core computer science contributions, this project (and its predecessor) has also contributed to domain science results:
[D. Fink, W.
M. Hochachka, B. Zuckerberg, D. W. Winkler, B. Shaby, M. A. Munson, G.
Hooker, M. Riedewald, D. Sheldon, and S. Kelling.
Spatiotemporal Exploratory Models for
Broad-Scale Survey Data. Ecological Applications, 20(8):2131-2147, 2010]
[S. Kelling,
W. M. Hochachka, D. Fink, M. Riedewald, R. Caruana, G. Ballard, and G. Hooker.
Data Intensive Science: A New
Paradigm for Biodiversity Studies. BioScience, 57(7):613-620, 2009]
[W. M. Hochachka, R. Caruana, D. Fink, A. Munson, M. Riedewald, D. Sorokina, and
S. Kelling. Data-Mining Discovery of Pattern and Process in Ecological Systems. In
Journal of Wildlife Management, 71(7):2427--2437, 2007]
Mirek Riedewald
Daniel Fink (Cornell Lab of Ornithology)
Alper Okcan (Northeastern U. Ph.D. student)
Wesley M. Hochachka (Cornell Lab of Ornithology)
Giles Hooker
(Cornell Dept. of Biological Statistics and Computational Biology)
Steve Kelling (Cornell Lab of Ornithology)
Kevin Webb (Cornell Lab of Ornithology)
Gawande Pratik Bhagwat (Northeastern U. MS student while
working on the project)
Priyank Desai (Northeastern U. MS student while
working on the project)
Sahib S. Dhindsa (Cornell ISST undergrad student while working on the
project)
Alexander Lachmann (visiting Cornell CS undergrad student while working on the project)
Shweta S. Memane (Northeastern U. MS student while working on the project)
Biswanath Panda
(Cornell Ph.D. student while working on the project)
Mathi Ramakrishnan (Northeastern U. MS student while working on the project)
Baturalp Torun (Northeastern U. MS student while working on the project)
 This
material is based upon work supported by the National Science Foundation under
Grant Nos.
0612031,
0920869, and
1017793. Any opinions, findings, and conclusions or recommendations
expressed in this material are those of the authors and do not necessarily
reflect the views of the National Science Foundation.