The following problems appeared as a project in the edX course ColumbiaX: CSMM.102x Machine Learning.
In this assignment the following clustering algorithms will be implemented:
- Hard clustering with K-means
- Soft clustering with
a. Weighted K-means
b. Gaussian mixture models with Expectation Maximization.
Some datasets with n data points {x_1,…,x_n} will be used for testing the algorithms, where each x_i ∈ R^d.
Hard Clustering
- Each point is assigned to a one and only one cluster (hard assignment).
- With K-means we try to find K centroids {μ1,…,μK} and the corresponding assignments of each data point {c1,…,cn} where each ci∈{1,…,K} and c_i indicates which of the K clusters the observation x_i belongs to. The objective function that we seek to minimize can be written as

Soft Clustering
(1) Each point is assigned to all the clusters with different weights or probabilities (soft assignment).
(2) With Weighed K-means we try to compute the weights ϕ_i(k) for each data point i to the cluster k as minimizing the following objective:

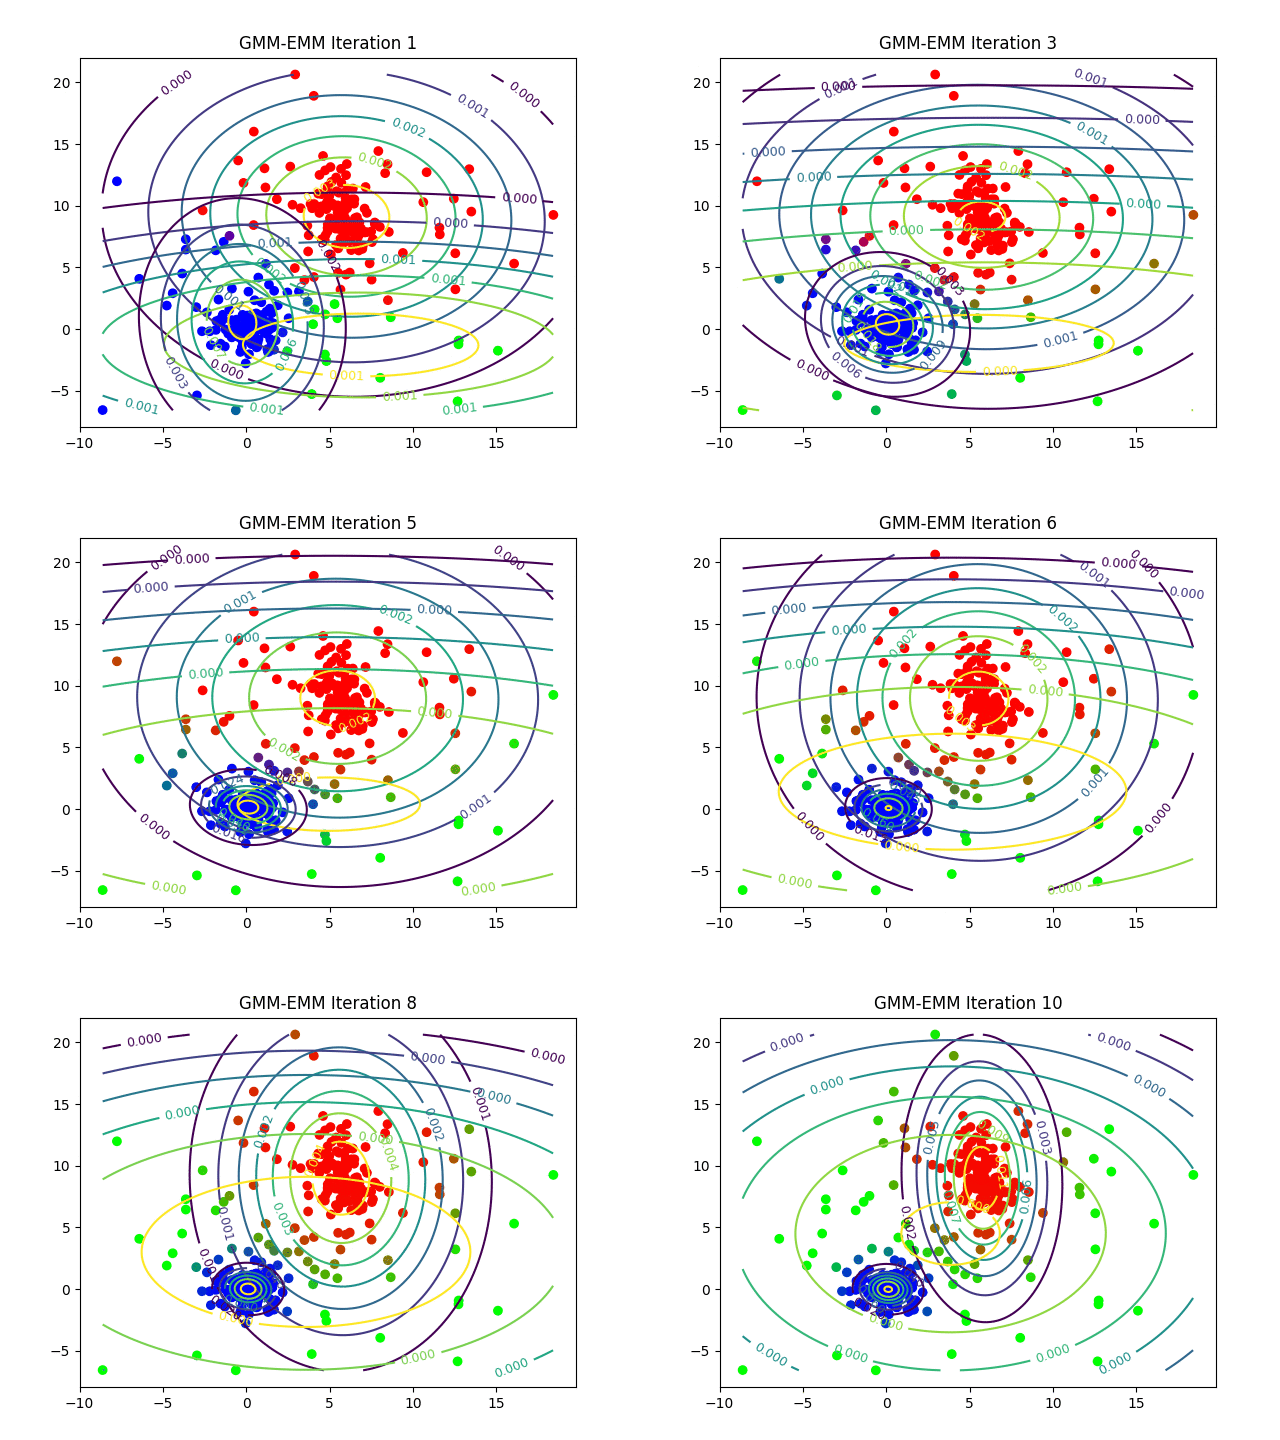
(3) With GMM-EM we can do soft clustering too. The EM algorithm can be used to learn the parameters of a Gaussian mixture model. For this model, we assume a generative process for the data as follows:

In other words, the i_th observation is first assigned to one of K clusters according to the probabilities in vector π, and the value of observation x_i is then generated from one of K multivariate Gaussian distributions, using the mean and covariance indexed by c_i. The EM algorithm seeks to maximize

over all parameters π,μ1,…,μK,Σ1,…,ΣK using the cluster assignments c1,…,cn as the hidden data.
The following figures show the algorithms that are going to be implemented for clustering.


The following animations show the output of the clustering algorithms (and how they converge with different iterations) on a few datasets (with k=3 clusters), the weighted k-means is run with the stiffness-parameter beta=10.
Dataset1


Dataset2


Dataset3


Dataset4


Dataset5


Dataset6


Dataset7


Dataset8

The next animation shows the results with weighted K-means with stiffness parameter beta=10

The next animation shows the results with weighted K-means with stiffness parameter beta=1


Here is how the log-likelihood for EM continuously increases over the iterations for a particular dataset:

The following animations show GMM EM convergence on a few more datasets:


