Last modified:
Some resources:
As always, you must write your own code to solve this problem.
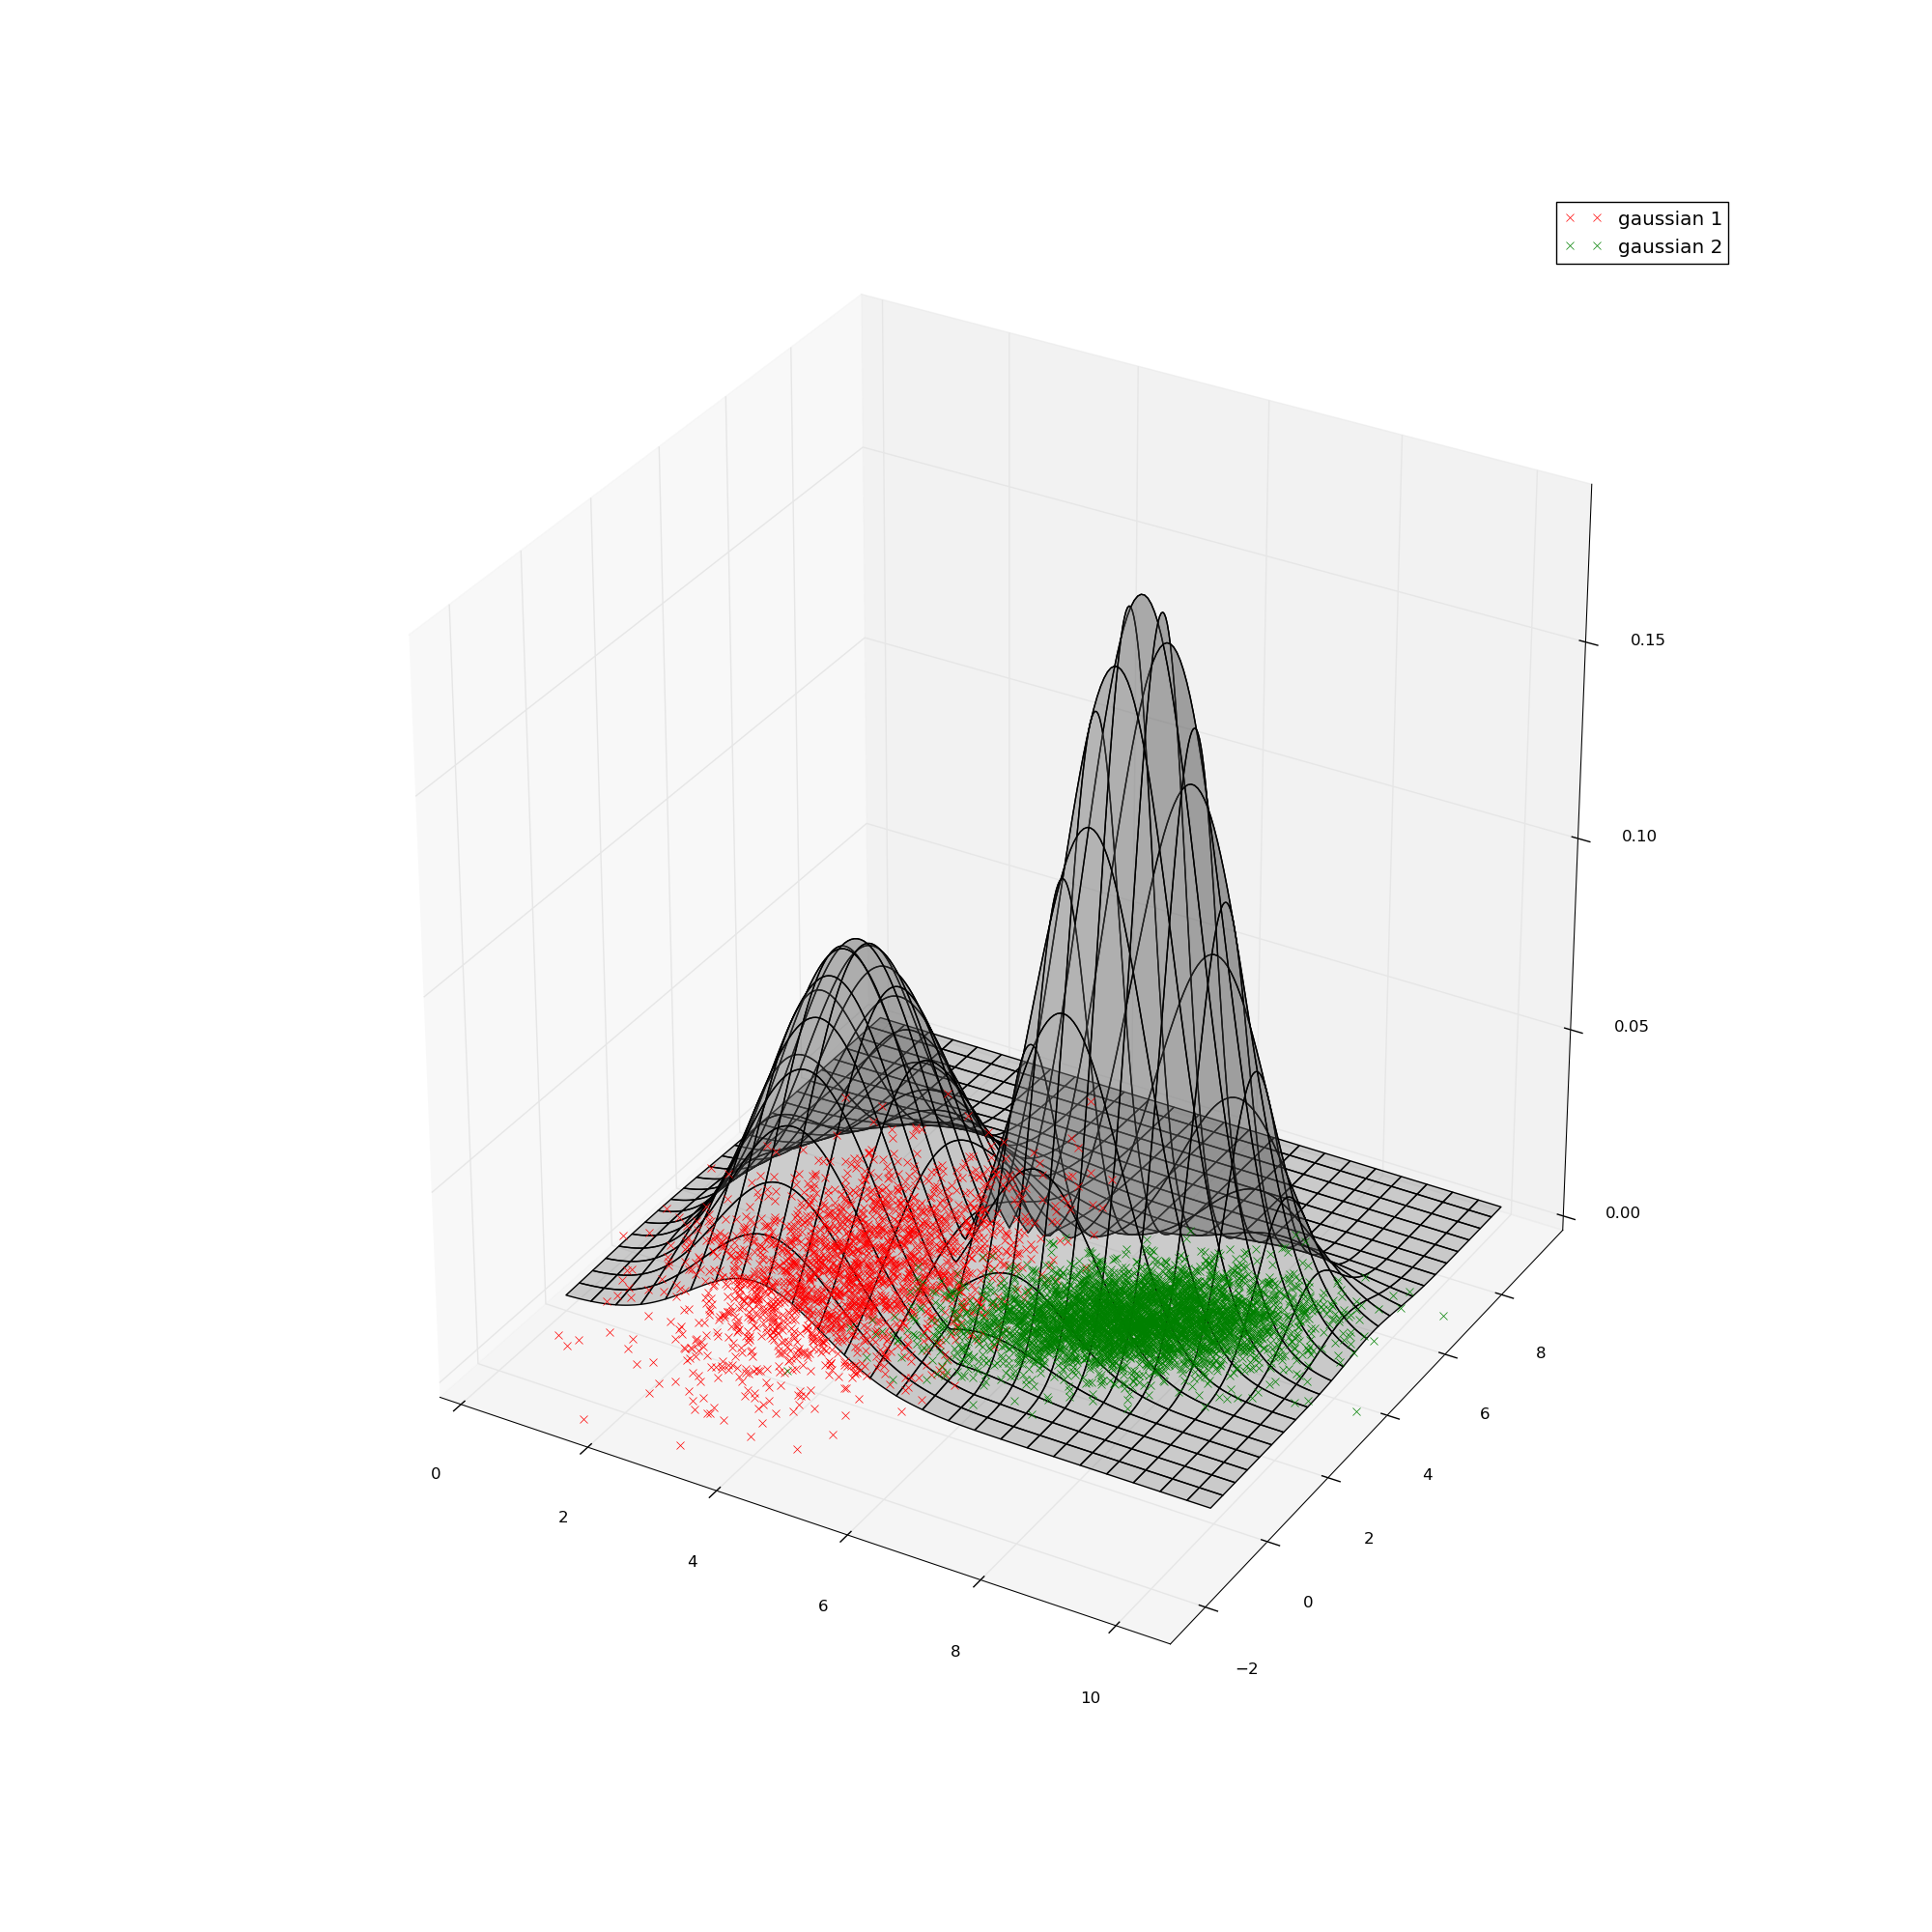
mean_1 = [3,3]; cov_1 = [[1,0],[0,3]]; n1 = 2000 points
mean_2 = [7,4]; cov_2 = [[1,0.5],[0.5,1]]; n2 = 4000 points
Run the EM algorithm with random initial values to recover the parameters. You should obtain a result visually like this, though you are not required to create such a plot.
mean_1 = [3,3] ; cov_1 = [[1,0],[0,3]]; n1=2000
mean_2 = [7,4] ; cov_2 = [[1,0.5],[0.5,1]]; n2=3000
mean_3 = [5,7] ; cov_3 = [[1,0.2],[0.2,1]]; n3=5000
Verify your findings against the true parameters used to generate the data.
Consider the Naive Bayes classifier you developed in HW02. There we modeled each 1-dimensional feature separately as a Bernoulli random variable, a four-bucket histogram, and a Gaussian. (We actually used two such distributions for each feature, one each for the positive and negative data.) In this problem, you will model each 1-dimensional feature using a mixture of k Gaussians.
Use EM to estimate the 3k parameters for each feature
mean1, var1, w1; mean2, var2, w2; ...; meank, vark, wk,
where the weight vector is constrained by
w1 +w2 + ... + wk = 1.
You will need separate mixtures for the positive and negative data, for each feature. We observed best results for k = 9 in our experiments, though feel free to experiment with that parameter.
Train and test your algorithm on Fold 1, computing an ROC curve and the overall AUC. Compare your results on Fold 1 with the results you obtained for that fold using Naive Bayes with just one Gaussian.
Note: Two extra credit problems will be added shortly.