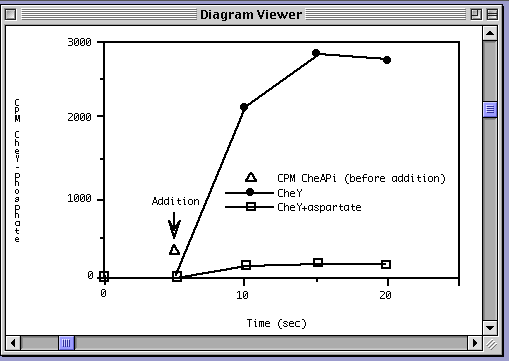
We have concentrated on diagrams taken directly from the published literature, rather than simple, stylized diagrams that we create. The diagrams consist of anywhere from 50 to 1000 primitives (lines, polygons, text, circles, and Bezier curves). All diagrams in this demonstration were redrawn by us from the printed originals to produce the vector form needed by our system. Here is a such a diagram (Borkovich and Simon, Cell, 63, 1990, pg. 1343), as shown in the DUS Diagram Viewer.

A grammar that defines the structure of such an x,y data graph (a Context-Based Constraint Grammar) is used to analyze (parse) the diagram. The parse is a collection of interrelated graphical objects, from primitives such as lines or Bezier curves, to higher-level objects such as X-Axis or Data-Cluster.
Parsing proceeds in three steps:
The diagram viewing system, DUSI (DUS Inspector) is used to examine the relation between the solution objects and the corresponding visually observable structures. All the figures in this set of web pages were obtained as screen shots from DUSI.
A number of our papers on diagram research have been posted on the Web by my colleague, Nikos Nikolakis.
| Next: Visualizing the relation between objects and images |
| Back to Index page |